
Using Leaflet to create maps that actually tell a story
A map is not a floor plan. It is a stage. Leaflet, used with intent, transforms geographic data into visual narrative — and every project proves it differently.
Leaflet is a lightweight, open-source JavaScript library designed to display interactive maps in a browser. On paper, it is a cartography tool. In practice, it is a playground for telling stories with geolocated data.
Three recent projects illustrate how far you can push this tool when you approach it with a creative and narrative intent rather than a purely functional one.
Milmurs: mapping street art across the Caribbean
Milmurs Production is a mural creation studio active in Martinique, mainland France and Montreal. The challenge of their map was to convey the geographic density of their work — connecting artworks to their territories without falling into a simple address directory.
The map at milmurs.com/cartes groups works by area, with enriched popups that let you see each mural in context. The dark base map amplifies the colours of the works. Navigation is intuitive: hover an area, click, and you find yourself in front of a mural on a street in Fort-de-France or Montreal.
What is interesting on the code side: dynamic clusters that open as you zoom in, and the integration of custom data in the markers to link each point to a Kirby CMS project.
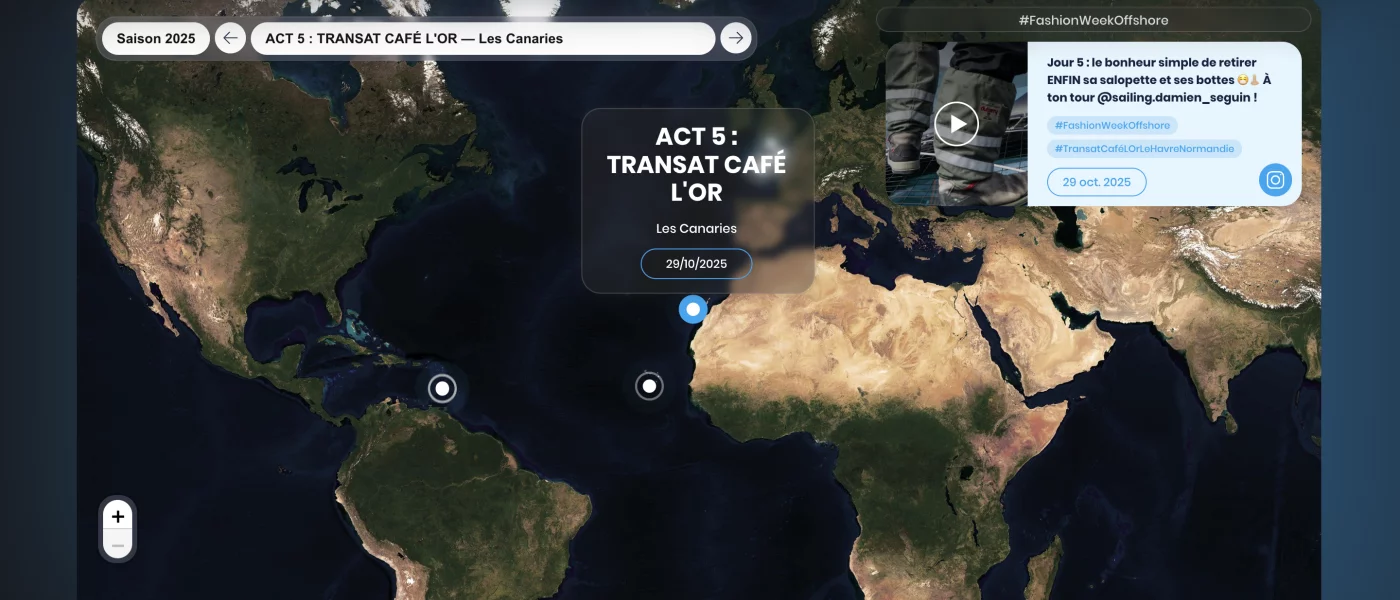
Solidaires en Peloton: following the adventure season by season
The Solidaires en Peloton challenge combines sailing and cycling in a charitable adventure with a different route each year. The map at defi-voile-solidairesenpeloton.com needed to let visitors relive each edition — seeing the stages, the stopovers, the distances covered.
The interface offers four tabs corresponding to the 2022, 2023, 2024 and 2025 seasons. Each season displays its own route and waypoints. You can switch between years and visually compare the routes, seeing how the challenge has evolved.
Technically, the challenge was managing multiple data layers (one per season) fluidly, with clean transitions between states and legible routes even on mobile. Leaflet handles this natively through its layer system, and a little JavaScript is enough to orchestrate selective display.
Mekaapolis: a map as a gateway into a universe
Mekaapolis is an artistic project exploring visual mutations between technology, futurism and cultures. The map at mekaapolis.com/fr/map is less a geographic map than a conceptual one: a navigation space within a fictional universe, where each point corresponds to a creation.
This is the most open-ended use of Leaflet of the three. The base map becomes a backdrop, the markers become portals. We are no longer in utilitarian cartography — we are in narrative cartography.
Why Leaflet rather than other solutions
Leaflet weighs around 40 KB. It has no dependencies. It works across all modern browsers and on mobile. Its API is clean and well documented. And above all, it leaves full control over visual rendering: base map, marker styles, popups, layers, animations.
Google Maps or Mapbox are powerful, but they impose their aesthetics and their logic. Leaflet steps out of the way and lets the project take centre stage. That is what you want when the map is a design element as much as a navigation tool.
What makes cartographic projects particularly satisfying to build is the feeling of transforming raw data — GPS coordinates, GPX tracks, lists of places — into something you actually want to explore. Code becomes a mise en scène.